How to Defeat Code Obfuscation While Reverse Engineering
Introduction
Obfuscation, or code distortion, is found in binaries where the programmer wanted to hide the original code. The programmer might be working for a major company that does not want their source code stolen. The programmer might also be a malware author who is attempting to make the malware binary appear legitimate. Either way, it is common practice in the malware and legitimate software industries to employ obfuscation techniques. In this article, you will learn about various methods involved in breaking open the code and revealing the chewy center where the legitimate code resides. It will discuss how to deal with packed binaries and how to extract obfuscated data directly from memory.
Unpacking
Packer algorithms are employed in order to distort the code of a compiled binary. A packing application takes the algorithm, runs the data of the binary through it, and attaches a decryption routine to the binary. The resulting file is a distorted version of the original and, if fed into a disassembler like IDA Pro, would reveal not much more than the decryption routine. This is useful to prevent novice reverse engineering of a binary or to hide the malicious functionality from AV software.
Packer Identification
The first step in dealing with a packed binary is to try to find out what kind of packer you are dealing with. There are numerous ways at doing this; however, I find that the easiest way is to use a packer identifier like PEID.
PEID
A great resource for the malware analyst or reverse engineer, PEID references an internal database full of different packer signatures in order to identify what packing algorithm is in use.
To use PEID, simply drag the binary onto the PEID interface and it will automatically analyze the file.The depressed section of the interface displays the packing algorithms detected. In the case of Figure 1,the file in question has been packed with the UPX packer algorithm.

Manual Identification
If you do not have access to PEID or it does not recognize the packer employed, you might have some luck by examining certain features of the binary, looking for anything that might reveal the packer. In some cases that is incredibly easy, for example figure 2 shows the file strings associated with a UPX packed file.

However, in most cases, it would be more difficult to determine the type of packer based on just strings.Additional information may be required for example, certain bytes of data located in specific file sections or even entire decryption routines may be required to identify the packer. In many cases it might be more trouble than it’s worth and unless your job is to determine what type of packer is being used and it is not detected with PEID, then it is best left unknown and you might not be able to unpack it in any easy way.
Custom Packer
While there are plenty of publicly known packers out there and many of them are used by both legitimate software and malware organizations, it does not mean they are the only ones used. Cyber-crime organizations will create their own “custom packer algorithm” which they can quickly modify in order to avoid AV detection. They could also implement anti-reversing and anti-unpacking measures and stay under the radar for longer periods.
Automated Unpacking
Now that we have identified the packer employed, we can try to unpack the binary. As is the key to reverse engineering anything efficiently, we want to see if we can skip some of the manual work and use automated methods. Depending on the packer, there is usually an unpacker application somewhere on the web you can download. There are also applications that can unpack multiple packing algorithms; an example of such is QUnpack.
QUnpack
When you want a tool that can unpack multiple packer types, QUnpack should be in your toolbox. It can detect packers like PEID can and unpack using multiple methods. In addition it can restore import tables, allow custom LUA scripting and an array of other useful functions.
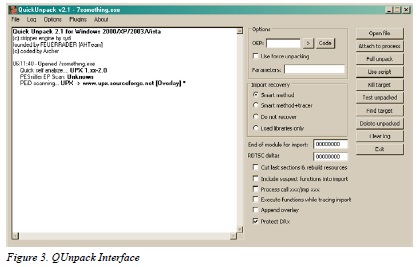
After opening QUnpack, you can just drag and drop the packed binary onto the interface. Once QUnpack identifies the binary and the packer, your first step is to tell QUnpack what is the Original Entry Point (OEP) of the binary. If you do not know it, you can let QUnpack find it for you by clicking the “>” button next to the OEP input box.
A listing of all available OEP Finder tools will pop up and all you need to do is select one, see figure 4. In this example, we selected the top one “Generic OEP Finder by Deroko & Archer.” Which one you decide to use is up to you. Generally, you want to use something other than ForceOEP if you can, only because the output for that finder has a lower accuracy. Each OEP finder might find either the same OEP as the others or a different one; feel free to experiment with different ones to find the best output for your needs. The OEP Finder interface has a listing of all the packed sections located within the file. We selected the OEP button to tell the finder to analyze the binary and detect the OEP automatically (Figure 5).
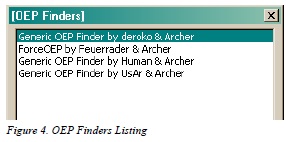


Figure 6 shows the OEP Finder asking whether the section of code it determines might be the OEP is in fact the OEP. Your knowledge of function headers in x86 assembly code can help you here and based upon the address scheme and use of the “__cdecl” function header, we decide that this is most likely the correct OEP. If the OEP Finder provided a possible OEP that we believe is false, we could select “No” and it would continue to suggest possible OEP locations.
With the OEP located, our next step is to click on the “Full Unpack” button on the right side of the QUnpack interface. The unpacker will analyze the binary and attempt to retrieve the import table. Keep in mind that this might not happen with other packers or a binary using a custom packer; lucky for us though, QUnpack gives us a listing of all the API functions it was able to retrieve and asks us if it is correct (Figure 7).
After selecting the “Save” button on the import interface, QUnpack finishes unpacking the binary and saves it in the same directory and with the same file name with the exception of a double underscore appended to the end (Figure 8).

At this point, we have successfully unpacked our binary using QUnpack and can now test in IDA Pro
whether or not the output binary is the complete original code or if we need to go back and try to unpack it with a different combination of options. Keep in mind that unpacking a binary is most useful when you want to observe the file statically using something like IDA Pro and I do not recommend running the unpacked binary in OllyDbg. Rather, navigating to the point in memory where the unpacked code resides and setting a breakpoint will ensure that the binary executes correctly.
Manual Unpacking
Automated unpacking is the most efficient way of revealing the true code of a packed binary. However, there may be some instances when using an unpacker might not work, in which case you will need to unpack the binary manually. You might find yourself in this situation if you are working on a binary that is packed with a custom algorithm or if dealing with a modified known packer, resulting in automated unpacking being ineffective.
In some cases, doing a simple search online might reveal instructions on how to unpack a certain type of packer algorithm manually or it might reveal nothing at all, be sure to check anyway in case it can save you some time. While the thought of manual unpacking might seem daunting, keep in mind that a binary must always unpack its own code before it can execute its functionality, therefore all we need to do is let the binary do the work for us.
IDA Pro Roadmap
Our first step in manually unpacking a binary is to determine where the unpacking algorithm ends and where the legitimate code begins. To do this, we open the packed binary in IDA Pro, it might not be obvious at first but the entry point function of the binary should lead you to the unpacking algorithm (Figure 9).

Once you find that algorithm, all you need to do is follow the code until you find a JMP or a CALL to
a function or a location that either does not exist or is nothing but random junk data. This is a good indicator that the location referenced is where the legitimate code will start. Figure 9 shows the instruction POPA, which POPs all top values off the stack and stores them in the registers. This instruction is a sign that the UPX unpacking algorithm is nearly completed (1) and then the actual JMP call to the unpacked code (2).
OllyDump
The next step is to open the binary in a debugger like OllyDbg and manually navigating to the address of the JMP or CALL instruction. Once there, set a breakpoint and execute the binary, the debugger should stop on the instruction and you can follow the instruction to the legitimate code, Figure 10 shows the unpacked legitimate code in OllyDbg.

There are usually two types of code you will find at this point, either the completely unpacked code or more unpacking algorithms; we will deal with the additional unpacker code shortly. If you have found the originalcode, we now need to be able to output the newly modified binary code so that we can view it statically using IDA Pro. To do this we use a plug-in included with OllyDbg known as “OllyDump” and it will allow us to dump the entire binary, unpacked code and all, into a new file.
To use OllyDump, simply find it in the “Plugins” dropdown menu at the top of the OllyDbg interface.
In the OllyDump sub-menu, select “Dump Debugged Process” (Figure 11).

The OllyDump interface will pop up and have an array of different values and options, at this point it
is a good idea to write down the Entry Point (EP), Modify and Size values because you will most likely need them later. In addition to taking down notes, make sure to de-select the “Rebuild Import” checkbox because we will be using a different tool to repair the import table for the dumped file (Fig ure 12).

Click on “Dump” and OllyDump will ask you where you want to save the dump file and under what name, keep this somewhere easy to get to and with a name like “Malware_dumped.exe.” At this point, we are done with OllyDump and have an unpacked binary that we can analyze statically in IDA Pro.However, the import table of the binary is not present and therefore even though the code is unpacked, none of the function calls will be apparent to us. Do not close OllyDbg because we will still need it.

ImpREC
To fix the import table issue, we will be using a tool called “ImpREC” or Import REconstructor. ImpREC analyzes a currently running program and extracts the loaded import table, which we will then be able to attach to our dumped binary.
To begin, we use the pull down menu at the top of the ImpREC screen to find the process matching our dumped file. Since OllyDbg keeps all binaries it is currently analyzing loaded in a suspended state, we can access the process for the binary we are currently analyzing; Figure 13 shows the process listing drop-down.
Once our process is loaded, we can try to let ImpREC find the Import Address Table (IAT) on its own by selecting the “IAT AutoSearch” button on the bottom left of the screen. This might not work and if that is the case, we need to pull out our notes on the EP, Modify and Size values provided by OllyDump. In Figure 14, we plugged in the modify value into the Original Entry Point (OEP) box and used the IAT AutoSearch to find an import table. By clicking the “Get Imports” button, all available import functions located in the IAT show up in the center of the screen.

Now that we have found an import table, all that remains is to fix the binary dump we made earlier.
We do this by selecting the “Fix Dump” button on the bottom of the screen and point to the dumped
binary from earlier (“malware_dumped.exe”). ImpREC will output in the “Log” box whether the operation was successful and if so, we now have a fully unpacked and import loaded version of our original binary. From here, you could use the unpacked binary to statically parse through the code and determine any obstacles you might come across (Figure 15).

Where this might not work
Let us be honest, if every malware used easy to get around packing and unpacking techniques, we would have no trouble catching them and analyzing them. Unfortunately, a lot of the more complex malware out there employs their own custom packers and even layers upon layers of packers. Therefore, even after performing the manual unpacking technique in this article you may still end up with packed code, in which case you may need to run through the entire technique again.
There is no end-all-be-all answer to unpacking malware or other binaries but that is where the detective aspect of a reverse engineer comes in. If you find yourself unable to reach the legitimate code for whatever reason, attack the problem from multiple angles, go online and ask for help or perform the code extraction techniques.
Obfuscated Code
Packers aside, even after unpacking a binary there still might be some obfuscated code hidden within that is yet to be decrypted or even created yet. A lot of malware will split up code sections when compiling and put them back together, decrypted, in new memory space to either run as a new thread, copied to a separate file or injected into a legitimate process. The techniques required to extract this code for static code analysis will not leave you with a neatly organized dumped binary, instead you will have non-executable files full of unattributed code that you have to do your best to decipher out of context or without the ability to step through the code dynamically using a debugger.
Finding the code
The first step in obtaining dynamically created, obfuscated code is to find it. You can accomplish this
in one of two ways, depending on how you prefer to do your reversing. The first way involves statically parsing through the code using IDA Pro; this is an effective method of reversing unless you come across a call to “WriteProcessMemory” that loads dynamically created code into virtual space. The other method, which is personally prefer, involves stepping through the code using a debugger, taking multiple snapshots at every “fork in the road” and using IDA Pro as a roadmap that we can comment, customize and use to make sure we are on the right path to find that hidden code.
IDA Pro Roadmap
The IDA Pro roadmap approach works best if you have two separate virtual machines, one for dynamically parsing through the code using a debugger like OllyDbg and the other for keeping your map up to date using IDA Pro. The purpose of keeping the two separate is because of the possibility that your IDA Pro save file might become corrupted, deleted or otherwise made useless and therefore forcing you to return to the start.
Personal technique involves creating as much of a picture , before ever executing the code
by renaming functions, commenting interesting chunks of code and creating a predicted path that we need the binary to follow in order to get to the more juicy functions.
The benefit of this technique is that you always know where you are going before you get there and the possibility of getting lost in the code by parsing through with only a debugger is slim to none. In addition, you can be prepared for the creation of dynamic memory and keep track of what variables are being referenced or what data is being copied. Find that when attempting to extract previously obfuscated code, this is the best method to find out where the code resides.

Figure 16 shows this technique in action by displaying a call to WriteProcessMemory found by referencing the import table for the binary. From here, the next step would be to rename the function that calls this API something unique like “CallToWriteProcMem.” Then by following cross references, make our way back to the start of the binary, leaving breadcrumbs along the way in the form of different colored function graphs and comments. In addition, we also have access to the variable used as the buffer for the function, which we can trace back to find out exactly where the obfuscated code will be loaded locally.
Now that the path is clear, we can navigate our way to the function call dynamically by using OllyDbg and using our roadmap. Figure 17 shows the function ready to execute as well as the variables passed to the function and the location of the buffer code. Our next step is to extract the buffer code to get a better look at it.

Extracting the Code
Finding the location of the obfuscated code is a big part of this entire process, however we are not out of the woods just yet. Now we need to extract that code so that we can analyze it statically using IDA Pro and figure out exactly what it does. In malware, code which is hidden in the memory of other processes, decrypted from a hidden section of the file or created dynamically after the binary is executed usually holds the most important, powerful and dangerous functionality. Before we go any further in attempting to extract it, we need to answer a few questions and list out what we know.

Figure 18 shows the current execution environment in OllyDbg before WriteProcessMemory executes, each number corresponds to what kind of data we know before execution.
• Based on the assembly code we know that the function is only called once, therefore the data located in the buffer is the entirety of the obfuscated code.
• Based on the current variables pushed onto the stack, we know the handle of the receiving process and the address of the buffer that holds the current data. We also know the size of the data, information that will be very useful if we need to extract the data manually.
• Based on the buffer data located at the referenced address, the data might be an executable binary since it has an MZ header.
Using the above information, we can successfully extract the obfuscated code in one of two ways, using an application to extract the data and extracting it manually.
LordPE
Our first method involves the use of a tool known as LordPE, a very powerful and useful PE editor. Using it, we can open the current process memory of our malware and extract the region of memory that includes the obfuscated code. To begin with, after opening LordPE we have to scan through the process listing and find our target “Malware.exe”; Figure 19 illustrates this.

When we find our process, we right click it and select the “Dump Region” option. Using the dump region interface, we scroll through all of the memory regions belonging to the file and find the one that correlates to the buffer memory address we observed previously.

In Figure 20, notice how the memory location 0x3E0000 has the size 0xD000, the same size as the data passed to WriteProcessMemory. Our next step is to simply dump the region and load it into IDA Pro either by itself or as an additional file to our currently loaded instance of IDA.
Manual Extraction
While rare, there might be an occasion when you cannot use LordPE to extract code from memory.
This might be due to memory locked by the binary using it. In any case, there is a way around this problem and it is as simple as ‘cut and paste’.
Using the previous example, we are going to extract the same code as we did with LordPE but by only using OllyDbg. The first step is to locate the memory location in the OllyDbg dump window to the lower left of the screen; the number 3 in figure 18 represents this window.
The next step is to double click on the memory address referenced by the code loading the obfuscated data, you should see a “==>” appear where the memory address was and notice that all other memory addresses in the dump are an offset from the original (Figure 21).

By scrolling down, navigate to the offset address that matches the size of the obfuscated data, in this case it would be 0xD000. Then Shift + R-Click the memory location and you should be selecting all the data between the origin address and the current address. Next, right click on the selection and navigate to the ‘Binary’ sub-menu and click “Binary Copy” (Figure 22).

Finally, open your favorite Hex editor to a new file and paste the external text as hex numbers, the data should appear inside of your text editor exactly as how they appeared in the OllyDbg dump window. Save the file as whatever you wish and load the file into IDA Pro to get a closer look.
Conclusion
One of the first steps in reverse engineering legitimate applications or malware is always breaking through any anti-reversing protection by using unpacking applications or just letting the code decrypt itself and ripping out the data from memory. You should now be able to de-obfuscate a binary protected by a known packer, custom packer or custom obfuscation methods by using the techniques included in this article. However, always keep in mind that new anti-reversing techniques are being developed all the time and with that, your own ability to defeat them will need to constantly be honed and practiced. Remember, no matter how encrypted, obfuscated or packed a binary is, the code must always be clean when it is executed and that is a vulnerability you can always exploit.
Introduction
Obfuscation, or code distortion, is found in binaries where the programmer wanted to hide the original code. The programmer might be working for a major company that does not want their source code stolen. The programmer might also be a malware author who is attempting to make the malware binary appear legitimate. Either way, it is common practice in the malware and legitimate software industries to employ obfuscation techniques. In this article, you will learn about various methods involved in breaking open the code and revealing the chewy center where the legitimate code resides. It will discuss how to deal with packed binaries and how to extract obfuscated data directly from memory.
Unpacking
Packer algorithms are employed in order to distort the code of a compiled binary. A packing application takes the algorithm, runs the data of the binary through it, and attaches a decryption routine to the binary. The resulting file is a distorted version of the original and, if fed into a disassembler like IDA Pro, would reveal not much more than the decryption routine. This is useful to prevent novice reverse engineering of a binary or to hide the malicious functionality from AV software.
Packer Identification
The first step in dealing with a packed binary is to try to find out what kind of packer you are dealing with. There are numerous ways at doing this; however, I find that the easiest way is to use a packer identifier like PEID.
PEID
A great resource for the malware analyst or reverse engineer, PEID references an internal database full of different packer signatures in order to identify what packing algorithm is in use.
To use PEID, simply drag the binary onto the PEID interface and it will automatically analyze the file.The depressed section of the interface displays the packing algorithms detected. In the case of Figure 1,the file in question has been packed with the UPX packer algorithm.
Manual Identification
If you do not have access to PEID or it does not recognize the packer employed, you might have some luck by examining certain features of the binary, looking for anything that might reveal the packer. In some cases that is incredibly easy, for example figure 2 shows the file strings associated with a UPX packed file.
However, in most cases, it would be more difficult to determine the type of packer based on just strings.Additional information may be required for example, certain bytes of data located in specific file sections or even entire decryption routines may be required to identify the packer. In many cases it might be more trouble than it’s worth and unless your job is to determine what type of packer is being used and it is not detected with PEID, then it is best left unknown and you might not be able to unpack it in any easy way.
Custom Packer
While there are plenty of publicly known packers out there and many of them are used by both legitimate software and malware organizations, it does not mean they are the only ones used. Cyber-crime organizations will create their own “custom packer algorithm” which they can quickly modify in order to avoid AV detection. They could also implement anti-reversing and anti-unpacking measures and stay under the radar for longer periods.
Automated Unpacking
Now that we have identified the packer employed, we can try to unpack the binary. As is the key to reverse engineering anything efficiently, we want to see if we can skip some of the manual work and use automated methods. Depending on the packer, there is usually an unpacker application somewhere on the web you can download. There are also applications that can unpack multiple packing algorithms; an example of such is QUnpack.
QUnpack
When you want a tool that can unpack multiple packer types, QUnpack should be in your toolbox. It can detect packers like PEID can and unpack using multiple methods. In addition it can restore import tables, allow custom LUA scripting and an array of other useful functions.
After opening QUnpack, you can just drag and drop the packed binary onto the interface. Once QUnpack identifies the binary and the packer, your first step is to tell QUnpack what is the Original Entry Point (OEP) of the binary. If you do not know it, you can let QUnpack find it for you by clicking the “>” button next to the OEP input box.
A listing of all available OEP Finder tools will pop up and all you need to do is select one, see figure 4. In this example, we selected the top one “Generic OEP Finder by Deroko & Archer.” Which one you decide to use is up to you. Generally, you want to use something other than ForceOEP if you can, only because the output for that finder has a lower accuracy. Each OEP finder might find either the same OEP as the others or a different one; feel free to experiment with different ones to find the best output for your needs. The OEP Finder interface has a listing of all the packed sections located within the file. We selected the OEP button to tell the finder to analyze the binary and detect the OEP automatically (Figure 5).
Figure 6 shows the OEP Finder asking whether the section of code it determines might be the OEP is in fact the OEP. Your knowledge of function headers in x86 assembly code can help you here and based upon the address scheme and use of the “__cdecl” function header, we decide that this is most likely the correct OEP. If the OEP Finder provided a possible OEP that we believe is false, we could select “No” and it would continue to suggest possible OEP locations.
With the OEP located, our next step is to click on the “Full Unpack” button on the right side of the QUnpack interface. The unpacker will analyze the binary and attempt to retrieve the import table. Keep in mind that this might not happen with other packers or a binary using a custom packer; lucky for us though, QUnpack gives us a listing of all the API functions it was able to retrieve and asks us if it is correct (Figure 7).
After selecting the “Save” button on the import interface, QUnpack finishes unpacking the binary and saves it in the same directory and with the same file name with the exception of a double underscore appended to the end (Figure 8).
At this point, we have successfully unpacked our binary using QUnpack and can now test in IDA Pro
whether or not the output binary is the complete original code or if we need to go back and try to unpack it with a different combination of options. Keep in mind that unpacking a binary is most useful when you want to observe the file statically using something like IDA Pro and I do not recommend running the unpacked binary in OllyDbg. Rather, navigating to the point in memory where the unpacked code resides and setting a breakpoint will ensure that the binary executes correctly.
Manual Unpacking
Automated unpacking is the most efficient way of revealing the true code of a packed binary. However, there may be some instances when using an unpacker might not work, in which case you will need to unpack the binary manually. You might find yourself in this situation if you are working on a binary that is packed with a custom algorithm or if dealing with a modified known packer, resulting in automated unpacking being ineffective.
In some cases, doing a simple search online might reveal instructions on how to unpack a certain type of packer algorithm manually or it might reveal nothing at all, be sure to check anyway in case it can save you some time. While the thought of manual unpacking might seem daunting, keep in mind that a binary must always unpack its own code before it can execute its functionality, therefore all we need to do is let the binary do the work for us.
IDA Pro Roadmap
Our first step in manually unpacking a binary is to determine where the unpacking algorithm ends and where the legitimate code begins. To do this, we open the packed binary in IDA Pro, it might not be obvious at first but the entry point function of the binary should lead you to the unpacking algorithm (Figure 9).
Once you find that algorithm, all you need to do is follow the code until you find a JMP or a CALL to
a function or a location that either does not exist or is nothing but random junk data. This is a good indicator that the location referenced is where the legitimate code will start. Figure 9 shows the instruction POPA, which POPs all top values off the stack and stores them in the registers. This instruction is a sign that the UPX unpacking algorithm is nearly completed (1) and then the actual JMP call to the unpacked code (2).
OllyDump
The next step is to open the binary in a debugger like OllyDbg and manually navigating to the address of the JMP or CALL instruction. Once there, set a breakpoint and execute the binary, the debugger should stop on the instruction and you can follow the instruction to the legitimate code, Figure 10 shows the unpacked legitimate code in OllyDbg.
There are usually two types of code you will find at this point, either the completely unpacked code or more unpacking algorithms; we will deal with the additional unpacker code shortly. If you have found the originalcode, we now need to be able to output the newly modified binary code so that we can view it statically using IDA Pro. To do this we use a plug-in included with OllyDbg known as “OllyDump” and it will allow us to dump the entire binary, unpacked code and all, into a new file.
To use OllyDump, simply find it in the “Plugins” dropdown menu at the top of the OllyDbg interface.
In the OllyDump sub-menu, select “Dump Debugged Process” (Figure 11).
The OllyDump interface will pop up and have an array of different values and options, at this point it
is a good idea to write down the Entry Point (EP), Modify and Size values because you will most likely need them later. In addition to taking down notes, make sure to de-select the “Rebuild Import” checkbox because we will be using a different tool to repair the import table for the dumped file (Fig ure 12).
Click on “Dump” and OllyDump will ask you where you want to save the dump file and under what name, keep this somewhere easy to get to and with a name like “Malware_dumped.exe.” At this point, we are done with OllyDump and have an unpacked binary that we can analyze statically in IDA Pro.However, the import table of the binary is not present and therefore even though the code is unpacked, none of the function calls will be apparent to us. Do not close OllyDbg because we will still need it.
ImpREC
To fix the import table issue, we will be using a tool called “ImpREC” or Import REconstructor. ImpREC analyzes a currently running program and extracts the loaded import table, which we will then be able to attach to our dumped binary.
To begin, we use the pull down menu at the top of the ImpREC screen to find the process matching our dumped file. Since OllyDbg keeps all binaries it is currently analyzing loaded in a suspended state, we can access the process for the binary we are currently analyzing; Figure 13 shows the process listing drop-down.
Once our process is loaded, we can try to let ImpREC find the Import Address Table (IAT) on its own by selecting the “IAT AutoSearch” button on the bottom left of the screen. This might not work and if that is the case, we need to pull out our notes on the EP, Modify and Size values provided by OllyDump. In Figure 14, we plugged in the modify value into the Original Entry Point (OEP) box and used the IAT AutoSearch to find an import table. By clicking the “Get Imports” button, all available import functions located in the IAT show up in the center of the screen.
Now that we have found an import table, all that remains is to fix the binary dump we made earlier.
We do this by selecting the “Fix Dump” button on the bottom of the screen and point to the dumped
binary from earlier (“malware_dumped.exe”). ImpREC will output in the “Log” box whether the operation was successful and if so, we now have a fully unpacked and import loaded version of our original binary. From here, you could use the unpacked binary to statically parse through the code and determine any obstacles you might come across (Figure 15).
Where this might not work
Let us be honest, if every malware used easy to get around packing and unpacking techniques, we would have no trouble catching them and analyzing them. Unfortunately, a lot of the more complex malware out there employs their own custom packers and even layers upon layers of packers. Therefore, even after performing the manual unpacking technique in this article you may still end up with packed code, in which case you may need to run through the entire technique again.
There is no end-all-be-all answer to unpacking malware or other binaries but that is where the detective aspect of a reverse engineer comes in. If you find yourself unable to reach the legitimate code for whatever reason, attack the problem from multiple angles, go online and ask for help or perform the code extraction techniques.
Obfuscated Code
Packers aside, even after unpacking a binary there still might be some obfuscated code hidden within that is yet to be decrypted or even created yet. A lot of malware will split up code sections when compiling and put them back together, decrypted, in new memory space to either run as a new thread, copied to a separate file or injected into a legitimate process. The techniques required to extract this code for static code analysis will not leave you with a neatly organized dumped binary, instead you will have non-executable files full of unattributed code that you have to do your best to decipher out of context or without the ability to step through the code dynamically using a debugger.
Finding the code
The first step in obtaining dynamically created, obfuscated code is to find it. You can accomplish this
in one of two ways, depending on how you prefer to do your reversing. The first way involves statically parsing through the code using IDA Pro; this is an effective method of reversing unless you come across a call to “WriteProcessMemory” that loads dynamically created code into virtual space. The other method, which is personally prefer, involves stepping through the code using a debugger, taking multiple snapshots at every “fork in the road” and using IDA Pro as a roadmap that we can comment, customize and use to make sure we are on the right path to find that hidden code.
IDA Pro Roadmap
The IDA Pro roadmap approach works best if you have two separate virtual machines, one for dynamically parsing through the code using a debugger like OllyDbg and the other for keeping your map up to date using IDA Pro. The purpose of keeping the two separate is because of the possibility that your IDA Pro save file might become corrupted, deleted or otherwise made useless and therefore forcing you to return to the start.
Personal technique involves creating as much of a picture , before ever executing the code
by renaming functions, commenting interesting chunks of code and creating a predicted path that we need the binary to follow in order to get to the more juicy functions.
The benefit of this technique is that you always know where you are going before you get there and the possibility of getting lost in the code by parsing through with only a debugger is slim to none. In addition, you can be prepared for the creation of dynamic memory and keep track of what variables are being referenced or what data is being copied. Find that when attempting to extract previously obfuscated code, this is the best method to find out where the code resides.
Figure 16 shows this technique in action by displaying a call to WriteProcessMemory found by referencing the import table for the binary. From here, the next step would be to rename the function that calls this API something unique like “CallToWriteProcMem.” Then by following cross references, make our way back to the start of the binary, leaving breadcrumbs along the way in the form of different colored function graphs and comments. In addition, we also have access to the variable used as the buffer for the function, which we can trace back to find out exactly where the obfuscated code will be loaded locally.
Now that the path is clear, we can navigate our way to the function call dynamically by using OllyDbg and using our roadmap. Figure 17 shows the function ready to execute as well as the variables passed to the function and the location of the buffer code. Our next step is to extract the buffer code to get a better look at it.
Extracting the Code
Finding the location of the obfuscated code is a big part of this entire process, however we are not out of the woods just yet. Now we need to extract that code so that we can analyze it statically using IDA Pro and figure out exactly what it does. In malware, code which is hidden in the memory of other processes, decrypted from a hidden section of the file or created dynamically after the binary is executed usually holds the most important, powerful and dangerous functionality. Before we go any further in attempting to extract it, we need to answer a few questions and list out what we know.
Figure 18 shows the current execution environment in OllyDbg before WriteProcessMemory executes, each number corresponds to what kind of data we know before execution.
• Based on the assembly code we know that the function is only called once, therefore the data located in the buffer is the entirety of the obfuscated code.
• Based on the current variables pushed onto the stack, we know the handle of the receiving process and the address of the buffer that holds the current data. We also know the size of the data, information that will be very useful if we need to extract the data manually.
• Based on the buffer data located at the referenced address, the data might be an executable binary since it has an MZ header.
Using the above information, we can successfully extract the obfuscated code in one of two ways, using an application to extract the data and extracting it manually.
LordPE
Our first method involves the use of a tool known as LordPE, a very powerful and useful PE editor. Using it, we can open the current process memory of our malware and extract the region of memory that includes the obfuscated code. To begin with, after opening LordPE we have to scan through the process listing and find our target “Malware.exe”; Figure 19 illustrates this.
When we find our process, we right click it and select the “Dump Region” option. Using the dump region interface, we scroll through all of the memory regions belonging to the file and find the one that correlates to the buffer memory address we observed previously.
In Figure 20, notice how the memory location 0x3E0000 has the size 0xD000, the same size as the data passed to WriteProcessMemory. Our next step is to simply dump the region and load it into IDA Pro either by itself or as an additional file to our currently loaded instance of IDA.
Manual Extraction
While rare, there might be an occasion when you cannot use LordPE to extract code from memory.
This might be due to memory locked by the binary using it. In any case, there is a way around this problem and it is as simple as ‘cut and paste’.
Using the previous example, we are going to extract the same code as we did with LordPE but by only using OllyDbg. The first step is to locate the memory location in the OllyDbg dump window to the lower left of the screen; the number 3 in figure 18 represents this window.
The next step is to double click on the memory address referenced by the code loading the obfuscated data, you should see a “==>” appear where the memory address was and notice that all other memory addresses in the dump are an offset from the original (Figure 21).
By scrolling down, navigate to the offset address that matches the size of the obfuscated data, in this case it would be 0xD000. Then Shift + R-Click the memory location and you should be selecting all the data between the origin address and the current address. Next, right click on the selection and navigate to the ‘Binary’ sub-menu and click “Binary Copy” (Figure 22).
Finally, open your favorite Hex editor to a new file and paste the external text as hex numbers, the data should appear inside of your text editor exactly as how they appeared in the OllyDbg dump window. Save the file as whatever you wish and load the file into IDA Pro to get a closer look.
Conclusion
One of the first steps in reverse engineering legitimate applications or malware is always breaking through any anti-reversing protection by using unpacking applications or just letting the code decrypt itself and ripping out the data from memory. You should now be able to de-obfuscate a binary protected by a known packer, custom packer or custom obfuscation methods by using the techniques included in this article. However, always keep in mind that new anti-reversing techniques are being developed all the time and with that, your own ability to defeat them will need to constantly be honed and practiced. Remember, no matter how encrypted, obfuscated or packed a binary is, the code must always be clean when it is executed and that is a vulnerability you can always exploit.